Statistical Significance Guide
How to Calculate Statistical Significance

Part II: How to Determine if My Research is Statistically Significant
Refresher: What is Statistical Significance?
What does it mean for research findings to be “statistically significant? ”
Simply stated, statistical significance is a way for researchers to quantify how likely it is that the results of a study are due to chance. This process, known as hypothesis testing, provides a framework for evaluating research claims and determining whether observed patterns are meaningful or merely coincidental.
Statistical significance testing involves several abstract concepts. So, we try to make things concrete with an example of how you might conduct a test of statistical significance.
How to Calculate Statistical Significance: A Step-by-Step Guide to Hypothesis Testing
Statistical Significance Testing in Psychological Research
Let's walk through a real example of hypothesis testing to see how researchers determine statistical significance in practice.
Everyone knows what it's like to feel regret. But only a few people are so interested in the feeling of regret that they would design experimental studies to investigate how far other people might go to avoid feeling regret. Jane Risen andThomas Gilovich are two such people.
In a 2008 paper titled, “Why People are Reluctant to Tempt Fate” Risen and Gilovich investigated how people's fear of feeling regret can lead them to engage in otherwise irrational behavior.
In their first experiment, people read about Jon—a young man who has just applied to graduate school. Jon really wants to attend Stanford, and knowing this, Jon's mother mails him a Stanford t-shirt. In the scenario, people read that Jon either:
b) tempted fate by wearing the shirt before hearing from Stanford.
After reading the scenario, people were asked: how likely is Jon to receive acceptance to Stanford (0 – not at all likely to 10 –extremely likely)?
As the authors expected, people who read that Jon wore the t-shirt were less likely to believe he would be accepted (M= 5.19, SD= 1.35) than those who read that he stuffed the shirt in a drawer (M= 6.13, SD= 1.02). The question, however, is whether the difference between groups is large enough to be statistically significant.
Understanding the Numbers: Mean and Standard Deviation
In sentences like the ones above, the 'M' represents the mean (average) rating, while 'SD' refers to the standard deviation—a measure of how spread out people's responses were. A smallerstandard deviation means people's answers clustered tightly around the average, while a larger one indicates more variability in responses. Standard deviation plays a crucial role in determining statistical significance: when there's less variability in the data, it's easier for researchers to detect real differences
To find out, the authors engaged in null hypothesis significance testing.
A 5 Step Model for Hypothesis Testing: Understanding Null Hypothesis Significance Testing
1. State the Null and Alternative Hypotheses
The first step in statistical significance testing is to adopt a null hypothesis. The null hypothesis takes a skeptical stance toward the researchers' data and assumes that whatever the researcher is studying does not really exist.
In the case of Risen and Gilovich's experiment, the null hypothesis was that tempting fate—wearing the t-shirt before hearing from Stanford—would have no effect on people's beliefs about whether Jon will be accepted to Stanford.
The alternative hypothesis, on the other hand, states that there is an effect of tempting fate on people's beliefs that Jon will be accepted to Stanford.
Both the null and alternative hypotheses are often more useful in theory than in practice. There are two reasons why. First, researchers rarely write down their hypotheses (although they are increasingly likely to pre-register their ideas and study materials). Quite often, the null and alternative hypotheses are implicit or assumed as part of statistical analysis.
Second, the null and alternative hypotheses apply to the population the researcher is studying, not the sample. Even though researchers rely on samples for data, the hypotheses they test and the models underlying them are assumed to occur at the population level (i.e., to people outside of the sample).
2. Set a Threshold for Statistical Significance
The second step in hypothesis testing is to set a threshold for statistical significance. Traditionally, the standard within academic research has been a significance level (or p value) of .05. This means researchers are only willing to accept their results as statistically significant if there is less than a 5% chance they would obtain the same results if the null hypothesis were true (i.e., if there is really no effect). In statistical terms, the significance level represents the acceptable risk of making a Type I error—incorrectly rejecting the null hypothesis when it's actually true (i.e., a false positive). Setting a stringent significance level (like .05 or lower) reduces the risk of Type I errors, but it comes with a trade-off: being too conservative might cause you to miss real effects that exist (called a false negative).
Understanding Statistical Errors in Hypothesis Testing
When conducting hypothesis testing, researchers must balance two types of potential errors. A Type I error occurs when you conclude there's an effect when there really isn't one—essentially a "false positive." The significance level (like .05) directly controls your risk of making this error. The flip side is a Type II error—failing to detect an effect that actually exists, or a "false negative." While Type I error rates are controlled by your significance level, Type II errors are influenced by factors like sample size and the strength of the effect you're studying. Understanding both types of errors are important for study design and interpretation.
Even though the .05 significance level is common within academia, there is nothing magical about it. Indeed, more than 30 years ago, two well-respected statisticians highlighted just how arbitrary the level is by writing, “…surely, God loves the .06 nearly as much as the .05.” In recent years, some academic researchers have called for the .05 significance level to become more stringent, dropping to.005.
Setting a threshold for statistical significance should occur within the context of your study's goals. If you are conducting a study for business, the significance level you adopt should be informed by how you plan to use the data. How important is the decision you're trying to make? What are the consequences of getting the decision wrong? How valuable is the course of action you plan to take if you are right? The answers to these questions might lead you to adopt a very conservative significance level or a more liberal one, perhaps even topping .10 or .20.
Your significance level should balance the desire to be confident in your results with the practical effect of the decision you plan to make.
Practical Tip 💡 In hypothesis testing, choosing your significance level isn't just about statistics. It's also about consequences. A pharmaceutical company testing a new drug might use .01 or even .001 to minimize Type I errors (approving an ineffective drug), while a marketing team testing email subject lines might comfortably use .10 because the cost of being wrong is relatively low.
3. Source a Sample and Gather Data
The third step is gathering data.
Because it is often impractical to gather data from everyone in the population of interest, researchers gather a sample. Data from the sample is used to make inferences about the population.
In Risen and Gilovich's study, for example, they were interested in the general feeling of regret. Their population of interest could reasonably be described as adults within the US or people from Western, industrialized nations. The sample they gathered, however, consisted of 62 undergraduate students at Cornell.
For many researchers today, the most efficient way to gather data is online. CloudResearch can help you quickly and easily gather data from large and diverse groups of people. Learn how CloudResearch's online sampling tools can help you find the sample you need and ensure you have enough statistical power for your hypothesis tests.
4. Determine if Your Data Are Statistically Significant
After gathering data, the next step in hypothesis testing is to run the statistical tests.
There are many different tests researchers can conduct, depending on the type of data they have. In the case of our example, Risen and Gilovich conducted a simple two groups t-test. Other common analyses include linear regression, chi-square tests, ANOVA, and Mann-Whitney u tests.
All statistical tests follow a formula. The t-test formula below converts the difference between two groups into a ratio:
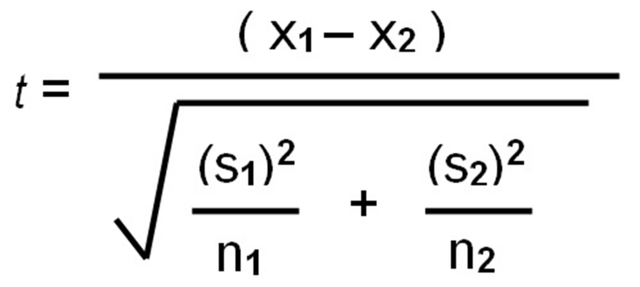
Once researchers have the ratio, they compare it to a probability distribution like the one below. If the t statistic falls beyond the threshold of significance, the researchers reject the null hypothesis and conclude that their effect is statistically significant.
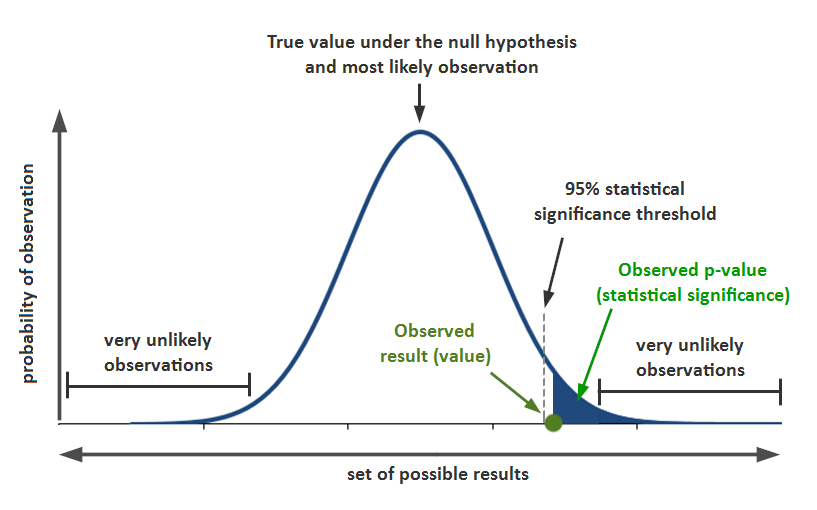
In Risen and Gilovich's study, for example, the researchers rejected the null hypothesis and concluded that the difference between the two groups was statistically significant because the probability of obtaining a t value equal to 3.01 or greater was 1% (t(60) = 3.01, p = .01, d = 0.78).
Although statistical tests can often be computed by hand, most researchers use an analysis program. Software packages like Tableau, SPSS, and Stata are commercially available and make such computations simple. Yet even in the absence of such software, researchers can often use programs like Microsoft Excel to simplify the execution of statistical analyses.
5. Interpret the Results
The final step in hypothesis testing is interpreting what your statistical test reveals. In Risen and Gilovich's study, their t-test revealed a statistically significant difference between the two groups. Because the p-value was less than their .05 threshold, they rejected the null hypothesis and concluded that tempting fate influences people's beliefs about outcomes.
This finding suggests more than just random chance was at work; there appears to be a genuine psychological effect where people believe that tempting fate can jinx positive outcomes. The researchers could be confident in this conclusion while acknowledging the inherent risk of a Type I error.
Understanding how to interpret your results means recognizing both what your statistics tell you and what they don't. Statistical significance indicates that an effect is unlikely due to chance, but it doesn't tell you whether the effect is practically meaningful or large enough to matter in the real-world. That's where your judgment as a researcher or decision-maker comes into play.
To make sound decisions, it's important for research to be statistically significant. CloudResearch helps tens of thousands of researchers get to the stage of significance testing by providing quick access to tens of millions of online research participants. Using our platform, you can find enough participants to conduct well-powered studies. And, if you don't have the resources or are unsure how to plan or analyze your study, we're here to help. Our expert team can help plan or manage any study you want to run. After the data are gathered, we can conduct advanced statistical analyses and interpret the data for you, saving your team time and resources.
Continue Reading: A Researcher's Guide to Statistical Significance and Sample Size Calculations


Related Articles

What Is Data Quality and Why Is It Important?
If you were a researcher studying human behavior 30 years ago, your options for identifying participants for your studies were limited. If you worked at a university, you might be...
Read More
How to Identify and Handle Invalid Responses to Online Surveys
As a researcher, you are aware that planning studies, designing materials and collecting data each take a lot of work. So when you get your hands on a new dataset,..
Read More